CAD/CAM Benchmarking Metrics: How to Compare Software Performance
Publication Date
author
Choosing CAD/CAM software requires more than comparing feature lists or vendor claims. Reliable CAD/CAM benchmarking metrics reveal performance under representative engineering workloads.
These workloads range from model regeneration and toolpath calculation to simulation accuracy and system resource consumption, all of which influence production decisions.
This guide explains how to design repeatable tests, control hardware and dataset variables, and interpret results alongside workflow compatibility and total cost.
The strongest candidate is not necessarily the fastest in one test. It is the system that meets accuracy, reliability, integration, and throughput requirements together.
Which CAD/CAM Benchmarking Metrics Matter Most?
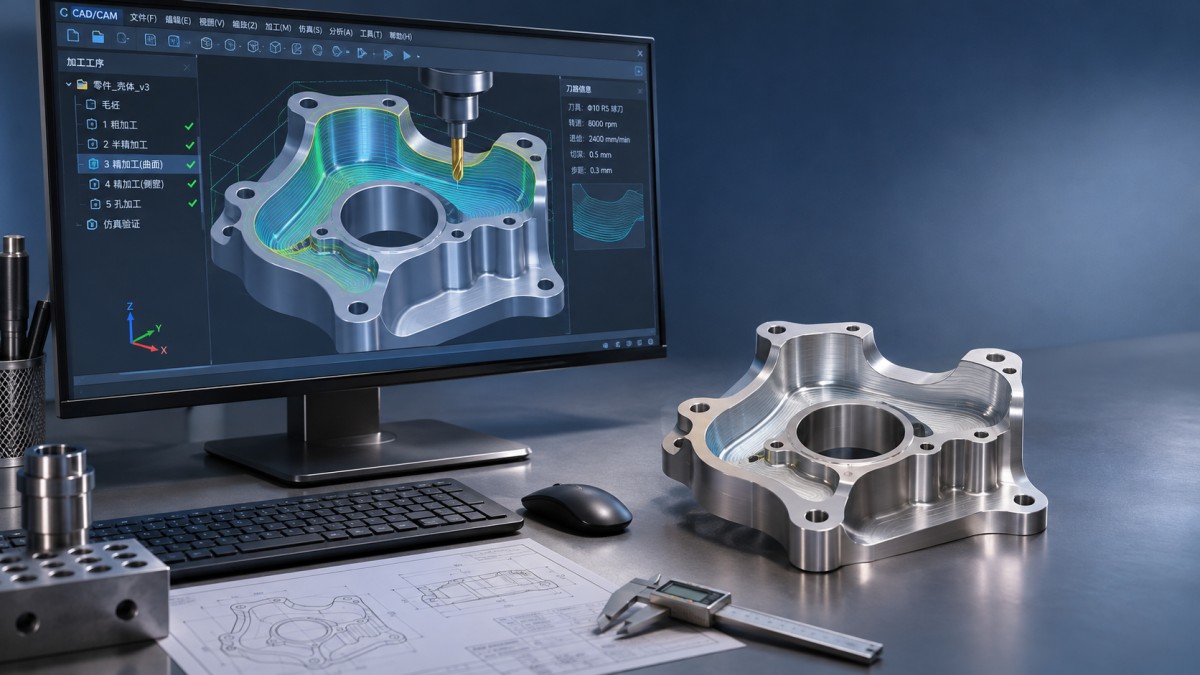
Start with tasks that constrain your actual workflow. A complex aerospace surface, a prismatic fixture, and a medical implant require different benchmark priorities.
Measure CAD interaction and regeneration, CAM programming and calculation, verification quality, output compatibility, and system resource use. Record reliability and operator effort across every test.
For each metric, specify its unit, measurement method, test conditions, and acceptance threshold before collecting results. Avoid comparing a vendor’s best case with another product’s defaults.
Use the following metrics as a practical starting point, then adjust their importance to match part complexity, machine capabilities, and production risk.
No single metric establishes overall quality. Report the results as a balanced profile, with mandatory requirements separated from preferences and commercial considerations.
How Should You Design a Fair Benchmark?
Build a representative test set from actual production work, subject to confidentiality controls. Include simple, typical, and difficult parts rather than only showcase models.
For CAD, select files that exercise relevant assemblies, feature histories, imported geometry, and drawing updates. For CAM, include actual materials, fixtures, and machine configurations.
Document part size, feature count, assembly structure, file format, and geometric complexity where practical. These descriptors help explain why results differ between workloads.
Define each task as a reproducible sequence with clear start and stop events. For example, time regeneration from confirming an edit until the model becomes interactive.
Test software on equivalent workstations with the same processor, memory, graphics driver, operating system, storage conditions, and power settings wherever possible.
Record application versions, service packs, modules, license types, and relevant settings. A result without this context may not apply to another configuration.
Use local files or a controlled network environment, and document background processes. Separate cold starts from warm starts because caches can change measured times.
Run each scenario several times, report the median and range, and investigate outliers. Record failures instead of quietly excluding them from the comparison.
Balance operator familiarity across products. Allow training and practice, then use a scripted task; otherwise, experience with one interface can dominate the result.
Where identical settings are impossible, define equivalent output requirements and disclose the differences. Matching button labels alone does not guarantee comparable geometry or toolpaths.
How Do You Measure CAD Performance Beyond Opening a File?
File opening is useful, but it rarely represents the entire design workload. Measure the sequence of actions engineers actually repeat during a project.
Time model regeneration after controlled changes, such as modifying a critical dimension or replacing an assembly component. Confirm that dependent features update successfully.
For large assemblies, measure loading, component selection, view manipulation, interference checks, and drawing generation. Note whether simplified display modes affect the comparison.
Evaluate responsiveness separately from batch operations. A system may complete regeneration quickly yet pause noticeably during selection, rotation, or sketch editing on demanding models.
For imported models, record translation time, missing or invalid geometry, repair effort, and resulting deviations. Identify whether measurements refer to surfaces, edges, or sampled points.
Compare translated geometry against a trusted reference using a documented method and tolerance. A successful import message alone does not establish manufacturing suitability.
Record source and target formats, including versions and export settings. Native, STEP, and other exchanges can preserve different features, metadata, and assembly relationships.
Also check downstream information such as units, coordinate systems, part names, and product manufacturing information when your workflow depends on those attributes.
How Can You Compare CAM Calculation and Programming Time?
Separate active programming time from unattended calculation time. Both matter, but they affect staffing and workstation capacity in different ways.
Measure programming from receipt of a prepared model to a verified, post-processed program. Define whether fixture setup, tool selection, and documentation are included.
Measure toolpath calculation from the command to calculate until the operation is complete and usable. Record individual operations as well as total job time.
Standardize tools, stock geometry, machine limits, tolerances, cutting parameters, and required surface coverage. Document unavoidable differences in machining strategies or available controls.
Compare outputs before declaring a winner. A faster calculation may produce a coarser path, leave more stock, or require extra finishing operations.
Track toolpath length, estimated cutting time, retracts, and non-cutting moves as diagnostic measures. Interpret them alongside tool engagement, surface requirements, and machine constraints.
Estimated cycle time is not the same as actual machining time. Controller look-ahead, acceleration, feed limits, and machine dynamics can materially change the result.
Where practical, validate candidate programs on the same machine and controller under controlled conditions. Use safe procedures and qualified personnel for every physical trial.
Report manual edits to the NC program and post-processor configuration effort. These activities can erase apparent savings from a fast calculation engine.
How Do You Test Simulation Accuracy and Manufacturing Risk?
Simulation should be assessed against defined failure modes, not simply whether the display looks convincing. Establish what each product models and what it omits.
Test representative collisions involving tools, holders, fixtures, and machine components. Confirm which events are detected and whether their locations are reported clearly.
Include known collision cases and known clearance cases where feasible. This helps reveal missed events and false alarms, both of which affect evaluator confidence.
Inspect stock removal and remaining material against a reference using a stated sampling method and tolerance. Report maximum deviation and where it occurs.
A visually smooth simulation does not prove that a physical part meets specification. Tessellation, numerical settings, machine behavior, and measurement uncertainty can influence results.
Compare the simulated output with a controlled machine trial when the decision warrants it. Inspect the resulting part using suitable calibrated measurement equipment.
Document the machine model, controller, post-processor version, tool assembly, and fixture assumptions. A verification result is only meaningful within those stated conditions.
For regulated or safety-critical work, align acceptance criteria and evidence retention with applicable customer, quality-system, and regulatory requirements. Software benchmarks do not establish certification.
What Resource and Reliability Data Should You Capture?
Monitor peak memory, processor utilization, graphics memory where available, and storage activity during demanding tasks. Record the monitoring tool and sampling interval.
Peak RAM is particularly useful for workstation planning: paging to disk can distort timing and make a configuration impractical for large jobs.
High CPU utilization is not inherently better. Compare elapsed time, resource use, and responsiveness together, especially when engineers run multiple applications concurrently.
Record crashes, failed calculations, corrupted outputs, and unsuccessful imports by scenario. Include the number of attempts so that failure rates have a denominator.
Measure recovery time from interruption to usable work, including reopening files and restoring unsaved changes. Test recovery only on controlled copies of data.
A short benchmark cannot establish long-term reliability or mean time between failures. Use pilot deployments and support records to extend the evidence base.
For network licenses or cloud services, test realistic concurrency and connectivity conditions. Note license checkout delays, service dependencies, and behavior during interruptions.
How Should Results Be Scored and Compared?
First apply pass-or-fail gates for nonnegotiable requirements, such as supported controllers, required file exchange, collision detection, and acceptable geometric deviation.
Then weight the remaining criteria according to the workflow. A high-mix machine shop may prioritize programming effort, while a design team emphasizes assembly responsiveness.
As an illustrative starting point, assign 25% to CAD performance, 25% to CAM productivity, 25% to verification and output, and 25% to operational fit.
Adjust those weights before testing and document the rationale. Safety or quality requirements should remain mandatory gates, not be offset by a low price.
Normalize scores within each criterion using a published rule, and retain the raw measurements beside them. This prevents a single composite score from hiding weaknesses.
For example, report median calculation time, active programming minutes, maximum measured deviation, and failure count together. Include the range and number of runs.
Check whether differences are meaningful in your workflow. A few seconds on an infrequent operation may matter less than repeated manual repair or post-processing.
When results are close or variable, repeat the test or run a longer pilot. Avoid treating small timing differences as decisive without supporting evidence.
How Do Workflow Compatibility and Total Cost Change the Decision?
A technically capable product can still create friction if it cannot exchange reliable data with existing design tools, machine controllers, or production systems.
Test representative handoffs with suppliers and internal teams. Include file revisions, metadata, tool libraries, post-processors, and approval processes rather than isolated import demonstrations.
Estimate total cost over a defined period, including licenses, required modules, maintenance, training, implementation, workstation upgrades, and post-processor development or support.
Include recurring labor for programming, verification, model repair, and administration. Keep estimated productivity savings separate from measured pilot results and state the assumptions.
For a simple comparison, calculate annual engineering hours as jobs per year multiplied by average active hours per job, then apply an appropriate labor rate.
Add expected implementation and operating costs, but avoid counting the same savings twice. Treat scrap and downtime reductions as estimates unless supported by representative evidence.
Ask vendors to identify optional modules, hardware dependencies, support response terms, and upgrade conditions. Confirm that benchmarked capabilities are included in the quoted configuration.
Run a pilot with actual users before procurement. Capture completion rates, support requests, acceptance findings, and any changes needed to integrate the software.
Conclusion: Choose Evidence That Matches the Work
Effective CAD/CAM benchmarking metrics connect measured performance to the parts, people, machines, and quality requirements that define your production environment.
Use repeatable workloads, equivalent output requirements, and transparent reporting to identify tradeoffs. Treat speed as valuable only when accuracy, safety, and usability remain acceptable.
Make the final decision from mandatory requirements, representative results, operational fit, and documented costs. A controlled pilot provides the strongest bridge between benchmark and deployment.
Search News
Hot Articles
- Carbon Fiber StructuresHow to Specify Aerospace Carbon Fiber Assemblies for Lightweight, Load-Bearing PartsJul 11, 2026
- Machine VisionXiaomi, Alibaba DAMO Academy Drive Open-Source Robotics Model Ecosystem, Lowering Algorithm Development Barriers for Overseas SMEs Adopting Chinese Robotics SolutionsMar 30, 2026
- Cobots & ArmsShanxi 'AI+' Conference Showcases Embodied Intelligence with Multinational Buyer Engagement: Key Industry ImplicationsMar 30, 2026
Popular Tags
Recommended News
 Jul 11, 2026How to Specify Aerospace Carbon Fiber Assemblies for Lightweight, Load-Bearing PartsAerospace carbon fiber assemblies: learn how to specify laminate design, load data, joining methods, and inspection controls for lighter, reliable load-bearing aerospace parts.Elena Rostova (UAV Systems Researcher)
 Mar 30, 2026Xiaomi, Alibaba DAMO Academy Drive Open-Source Robotics Model Ecosystem, Lowering Algorithm Development Barriers for Overseas SMEs Adopting Chinese Robotics SolutionsXiaomi & Alibaba DAMO Academy's open-source robotics models lower algorithm barriers for global SMEs. Boost efficiency in manufacturing, logistics & smart retail with ROS 2 compatible solutions.TSV Data Lab
 Mar 30, 2026Shanxi 'AI+' Conference Showcases Embodied Intelligence with Multinational Buyer Engagement: Key Industry ImplicationsShanxi 'AI+' Conference highlights embodied intelligence with Tesla, Ubtech & Jiantao showcasing multimodal robotics. 40+ global buyers validated tech on-site, creating new B2B channels for industrial automation & AI solutions.Chen Wei (Automation Lead Engineer)
 Mar 30, 2026Zhongguancun Unveils 6G Integrated Sensing-Computing-Intelligence Platform to Empower Embodied Robots for Global Industrial ApplicationsZhongguancun's new 6G platform revolutionizes industrial robotics with <10ms latency, empowering global automotive, logistics & port automation. Discover how this tech boosts China's smart manufacturing exports.TSV Data Lab
 Mar 30, 2026Mech-Mind Tianjin Embodied Intelligence R&D and Production Base Goes Live, Cutting Delivery Time by 20%–30% for Global Customized AMR+Vision SolutionsMech-Mind's Tianjin AMR+Vision production base cuts delivery time by 20%-30% for欧美 & Latin American markets. Discover how this PLd-certified facility accelerates customized robotics solutions for smart manufacturing and logistics.Chen Wei (Automation Lead Engineer)
 Mar 30, 2026Boao Forum Reveals 'Co-evolution of Big and Small Brains' Trend in Humanoid Robots, China's Embodied Intelligence Accelerates Adaptation to Overseas Manufacturing Service ScenariosDiscover how China's humanoid robots, featuring 'Co-evolution of Big and Small Brains,' are revolutionizing global manufacturing. Learn about Embodied Tian Gong 3.0's ISO compliance and overseas deployment at Boao Forum 2026.Chen Wei (Automation Lead Engineer)
 Mar 30, 2026China Railway Industrial Secures Patent for Embodied Robotics in Material Handling, Boosting High-Precision Delivery Capabilities for Overseas Infrastructure and Manufacturing ProjectsChina Railway Industrial's new patent for embodied robotics in material handling boosts high-precision delivery for global infrastructure & manufacturing. Discover how this innovation enhances logistics accuracy in automotive, rail transit & EPC projects.Chen Wei (Automation Lead Engineer)
 Nov 05, 2026CAD/CAM Benchmarking Metrics: How to Compare Software PerformanceExplore CAD/CAM benchmarking metrics to compare speed, accuracy, reliability, and costs. Learn how to run fair tests and choose the right software.Victor Lin (Chief Software Architect)
 Nov 04, 2026Yole: Hesai Holds 62% of Global Robotaxi LiDAR MarketHesai held 62% of the global Robotaxi LiDAR market in 2025, according to Yole. Explore what this could mean for suppliers and procurement.TSV Data Lab
 Nov 04, 2026Choosing Sensors and Edge AI Devices for Industrial MonitoringChoose sensors and edge AI devices with confidence. Explore sensor selection, real-world performance testing, security, and lifecycle factors for industrial monitoring.TSV Data Lab
 Nov 03, 2026Research and Markets Forecasts $29.5 Billion AI Machine Vision Market by 2036AI machine vision could reach $29.5 billion by 2036. Explore how 3D vision, deep learning and smart factory investment are driving the market forecast.TSV Data Lab
 Nov 03, 2026Choosing a Technical Due Diligence Consultant: What to Look ForChoose a technical due diligence consultant with confidence. Learn how to assess expertise, evidence, independence, and proposals before you commit.Chen Wei (Automation Lead Engineer)
 Nov 02, 2026Two Additive Manufacturing National Standards Take Effect November 1Additive manufacturing national standards take effect November 1, 2026. Discover what they mean for harmful substance testing and data exchange.Dr. Marcus Vance
 Nov 02, 2026Robotic Automation for Flexible Production: Managing Product ChangeoversExplore robotics automation flexible production strategies to streamline product changeovers, reduce downtime, and improve safety and quality.Victor Lin (Chief Software Architect)
 Nov 01, 2026Industrial Pressure Transmitter Bulk Pricing: Quantity Discounts and Cost FactorsCompare industrial pressure transmitter bulk price options, quantity discounts, specifications, and landed costs to source compliant devices with confidence.Victor Lin (Chief Software Architect)
 Oct 31, 2026A3: North American Robot Orders Rose 24.8% Year on Year in Q3 2026North American robot orders rose 24.8% year on year in Q3 2026, according to A3. Explore the demand trends and what buyers should check before ordering.Chen Wei (Automation Lead Engineer)
 Oct 31, 2026Servo Motor MTBF for Robotics: How to Interpret Reliability RatingsServo motor MTBF for robotics: learn how to interpret reliability ratings, compare supplier evidence, and choose motors suited to your robot’s duty cycle.Chen Wei (Automation Lead Engineer)
 Oct 30, 2026Choosing a Procurement Content Provider: Data Quality and CoverageChoose a procurement content provider with confidence. Learn how to assess data quality, supplier coverage, traceability, and verification before you buy.Chen Wei (Automation Lead Engineer)
 Oct 29, 2026Shanghai Plan Targets 8,000 Humanoid Robots in Factories by 2028Shanghai's humanoid robot plan targets 8,000 factory deployments by 2028. Explore what it means for smart manufacturing and robot suppliers.Chen Wei (Automation Lead Engineer)
 Oct 29, 2026Aerospace Aluminum Alloy Strength: 2024-T3 vs. 7075-T6 ComparedCompare aerospace aluminum alloy strength in 2024-T3 vs. 7075-T6. Explore fatigue, corrosion, and weight trade-offs to choose the right alloy for your design.Dr. Marcus Vance
 Oct 28, 2026IDC: Global Quadruped Robot Shipments Rise 92.5% in H1 2026 as Volume and Value DivergeGlobal quadruped robot shipments rose 92.5% in H1 2026, according to IDC. Explore what diverging volume and value trends mean for industrial buyers and manufacturers.Chen Wei (Automation Lead Engineer)
 Oct 28, 2026Interpreting Industrial IoT Latency Data for Monitoring and Real-Time ControlInterpret industrial category latency data to assess jitter, deadline misses, and real-time readiness. Learn how to benchmark IIoT systems and choose monitoring and control solutions.TSV Data Lab
 Oct 27, 2026GXO and Agility Robotics Expand Partnership to Accelerate US Humanoid Robot DeploymentGXO and Agility Robotics plan to expand US humanoid robot deployment with Digit 4 in early 2027. Explore warehouse automation plans, service terms and future Digit 5 upgrades.Chen Wei (Automation Lead Engineer)
 Oct 27, 2026Robotic Automation Costs: Budgeting for Equipment, Integration, and MaintenancePlan your robotics automation cost with confidence. Explore equipment, integration, and maintenance expenses, compare quotes, and build a realistic budget for better ROI.Chen Wei (Automation Lead Engineer)